
Figures that don’t match
Every department has its own spreadsheet, and none of them agree.
EXPERTISE · DATA & PERFORMANCE
Data engineering, dashboards, automated reports and predictive models: data that drives management decisions.
WHY IT’S CRITICAL
We build the data pipelines that turn scattered files and databases into reliable indicators: collection, quality, warehouse, dashboards, automated reports. Then the models that anticipate: scoring, prediction, segmentation.
That is what OMER does for Orange’s Mobile Money and Airtime distribution in Côte d’Ivoire and Burkina Faso.
THE CHALLENGES
Every department has its own spreadsheet, and none of them agree.
Reports arrive when it’s too late to act.
Logs, files and business databases that are never used.
WHAT WE DO
Services that combine to fit your context, from scoping to operations.
Collection, ETL, data warehouse and data lake.
Management KPIs and automated reports.
Machine learning models to anticipate.
Quality rules, database reconciliation, revenue assurance.
Automated reports for supervisory authorities.
Spatial analysis of activity and the field.
OUR APPROACH
Where the data is, who produces it, and at what quality.
Source mapQuality rules, warehouse, history.
Data foundationDashboards and reports for every use.
Shared KPIsPredictive models, evaluated and monitored.
Models in productionWHAT YOU GET
Scope, responsibilities and acceptance criteria are defined during scoping.
Source mapAnd quality rules.
Documented warehouse and data flowsWith monitoring.
Dashboards and reportsAutomated and shared.
Evaluated predictive modelsAnd monitored over time.
REFERENCES
ORANGE · CÔTE D’IVOIRE & BURKINA FASO
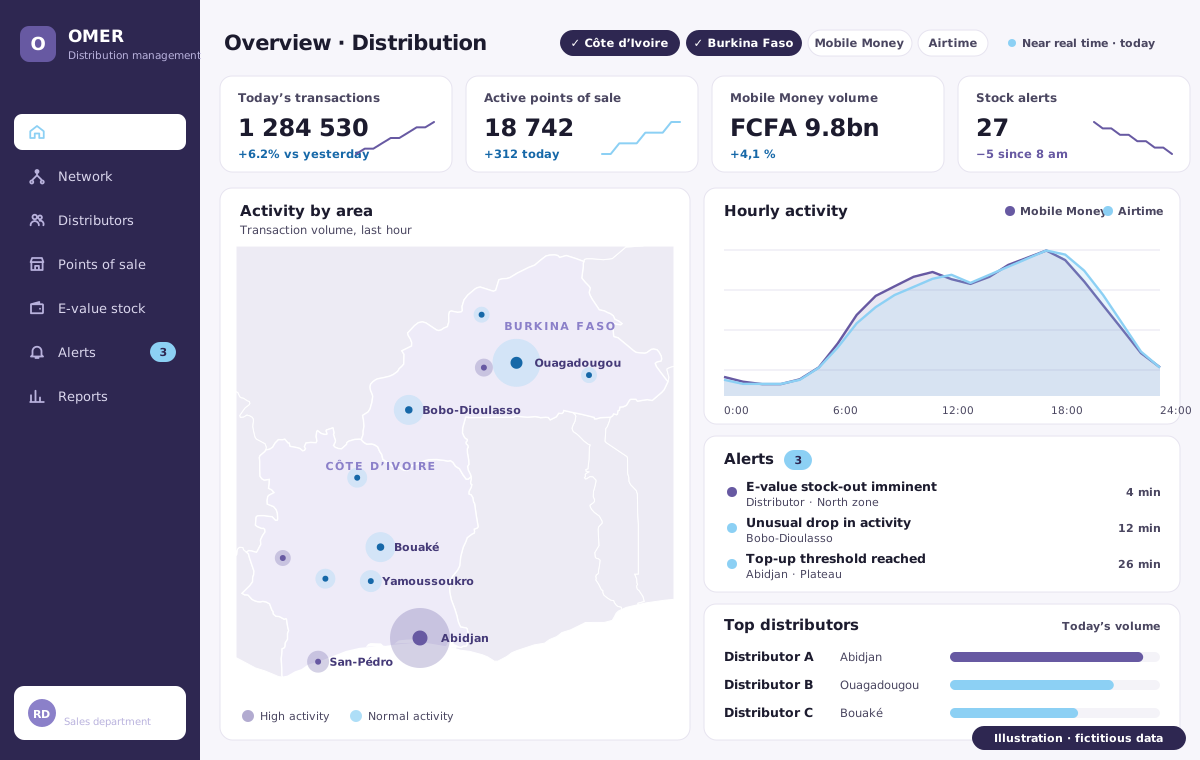
Point-of-sale scoring, stock-out prediction and hourly reports for sales teams.
Read the case study →Automated database reconciliation and revenue control.
From data collection to data sharing, to anticipate health alerts across the continent.
Case study →TECHNICAL ENVIRONMENT
Around thirty open-source and vendor solutions, chosen to fit your context. Technologies are confirmed during scoping.
FREQUENTLY ASKED QUESTIONS
No. We start with the indicators that matter for your decisions, then build the foundation as use cases are confirmed.
That’s the case for almost every project. Quality is handled within the pipeline: rules, controls, reconciliation and correction at the source.
Wherever your constraints require: in your data centres or with a hosting provider chosen with you, in line with applicable regulations.
GO FURTHER
GETTING STARTED
WHEN TO CALL US
Scattered data, manual dashboards, decisions made without reliable indicators.
FIRST ENGAGEMENT
A data scoping: sources, priority indicators and a first dashboard in production.
INDICATIVE DURATION
4 to 6 weeks
WHAT WE NEED FROM YOU
Access to data sources and a business owner for the indicators.